New: Unlock your Real Estate Data with Occupier Analytics Dashboard
Last Updated on February 9, 2023 by Morgan Beard
If you manage a real estate portfolio, then you know the grind of staying on top of critical dates, lease expirations, rent schedules and more. What if there was a visual representation of your real estate data that enables you to more easily analyze your portfolio happenings?
Well, there is! We are excited to announce Occupier Analytics for Lease Administration, a new and visually improved way to digest your real estate data. In fact, 65% of the population are visual learners, meaning they need to see their data to digest, understand, and make informed decisions from it.
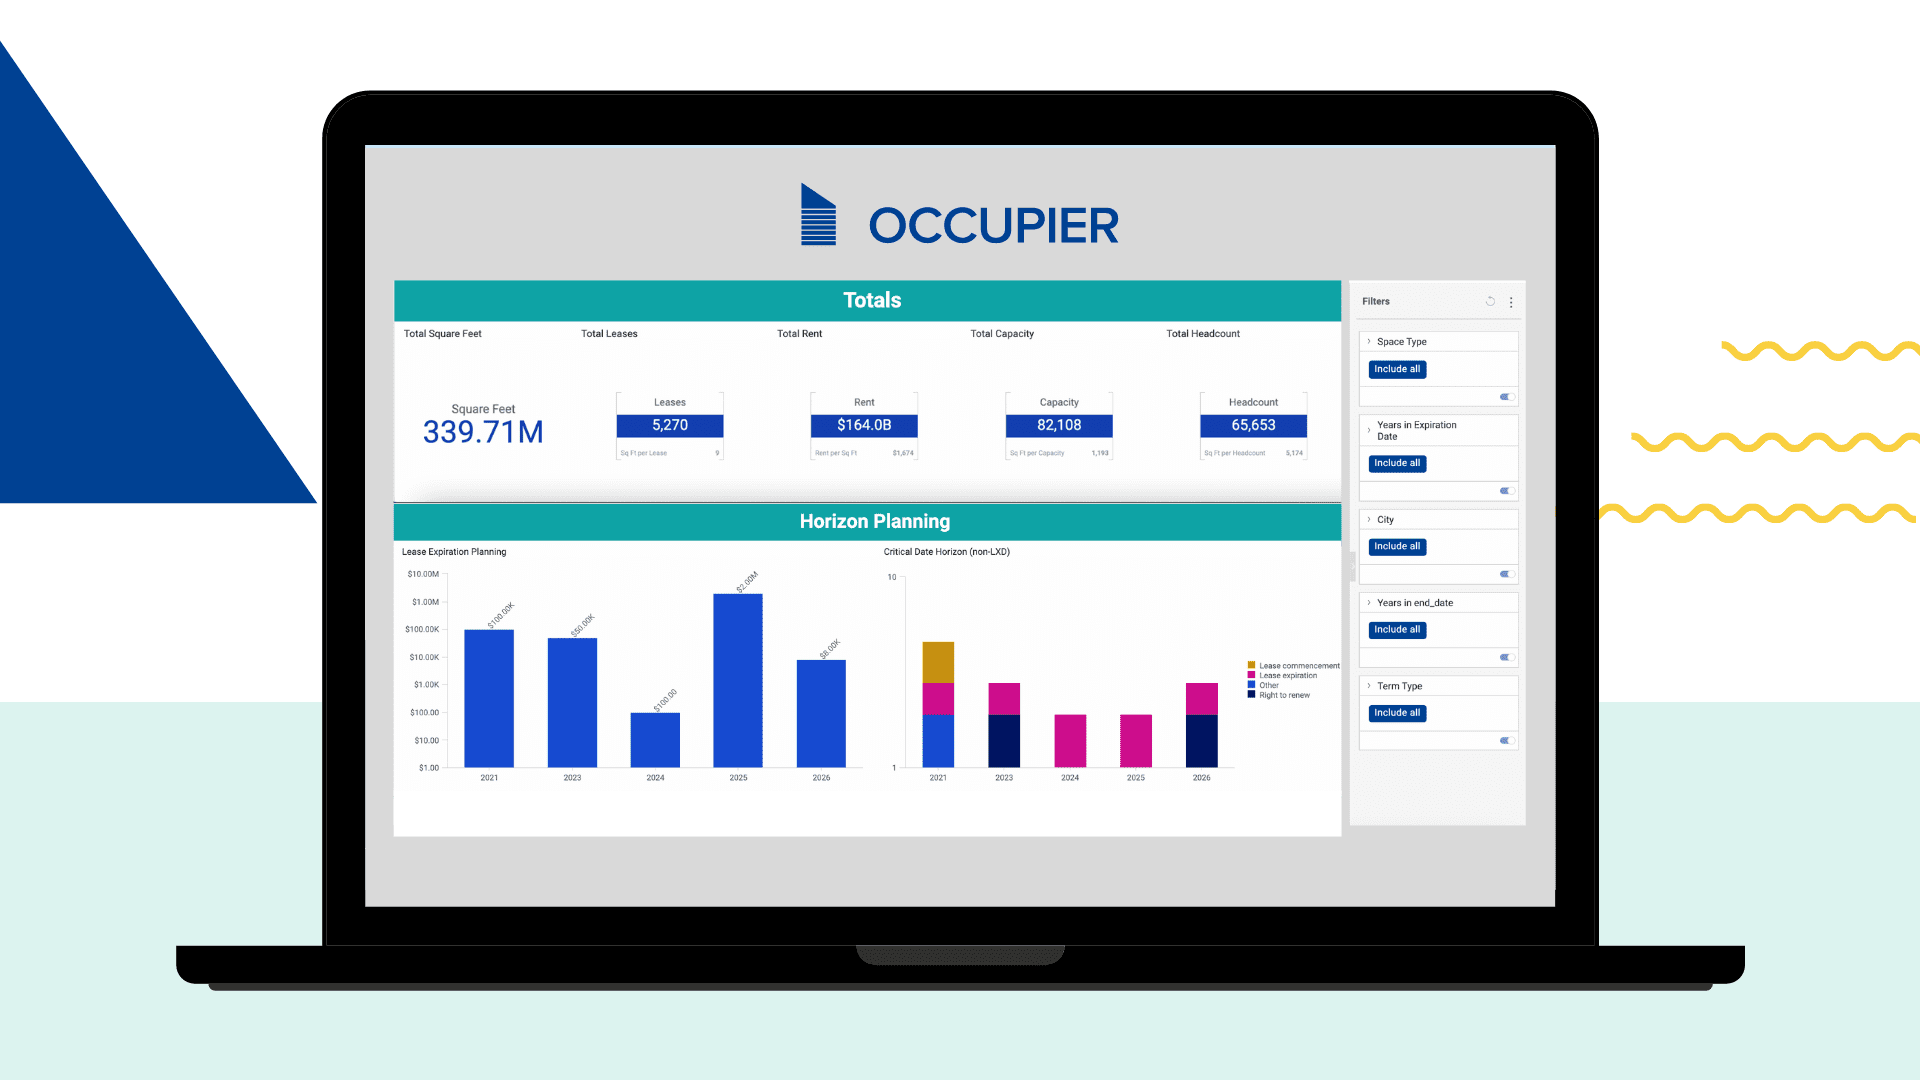
Our Analytics Dashboard module gives you a pulse on the data points that mean the most to your business. Unlock your real estate data with a few clicks and dive into your dashboard to learn more about your space types, critical dates, capacity, square footage and so much more.
More visualization and less spreadsheet sorting and calendar notifications
The Analytics Dashboard removes the manual work from your lease management workflows including: tracking your critical dates, your clauses, and rent obligations.
Are you curious what your rent per headcount is or your rent per square foot across your portfolio? Easily find that within your analytics dashboard. Horizon planning, portfolio totals, and space analytics are all organized in an easily digestible snapshot.
Horizon Planning Simplified
The horizon planning section gives your team insights into the risks and opportunities as they relate to lease expirations and rental payment obligations, as well as critical dates.
- Critical Date Horizon – The critical date horizon graph gives you a breakdown of the critical dates that need your attention from lease commencement, CPI adjustment, right to expand, TI allowance and so much more.
- Lease Expiration Planning – This bar graph gives you insights into lease expiration dates as well as a snapshot view of the rental obligations tied to your lease agreements.
You can now feel confident that your team has up-to-date horizon data at their fingertips enabling them to make important real estate decisions for your business.
Space Utilization Data
The space analytics data gives you a holistic view of your capacity in relation to your employee or staff headcount. In this section, your team can analyze headcount per square footage, capacity per square footage in addition to a breakdown of your leases by space type.
- Desk Ratio: This is measured by taking your employee headcount and dividing it by your capacity. For example, for many office space occupier’s there is a sweet spot in that you want your desk ratio to hover between 80% – 90%. That way you have room for additional hires or hot desks but at the same time your office space isn’t busting at the seams. This percentage varies per space type.
- Headcount by Space Type – How many employees or staff are there currently per space type, ie. office, co-working, retail etc.
- Capacity by Space Type – How many people in total can be accommodated per space type.
- Leases by Space Type – Analyze the type of space in your portfolio from office, to co-working, retail, warehouse and other. Then attribute the overall expenses of that space type.
Take Control of your Real Estate Data
The Occupier Analytics Dashboard gives you a pulse on the data points that mean the most to your business. Unlock your real estate data and with a few clicks you can analyze your dashboard to highlight the space types, critical dates, square footage and so much more.
- Portfolio Totals – Now you can evaluate your portfolio totals at a glance! From total leased assets, and total square footage to total headcount and so much more.
- Portfolio Averages – Who doesn’t love an average! Dive into your portfolio’s average capacity, headcount, square footage per location, space types and/or term type.
- Portfolio Analytics – Finance and real estate teams alike are going to love evaluating rent obligations per lease, per location, and per headcount.
- Desk Ratios – Determine the magic number of desks per capacity or per employee for your given space type.
- Space Type Planning – Dive into the details of your space types to better understand capacity, headcount, term type, and expense type by space types.
- Expense Analytics – Real estate is commonly a business’s second highest expense. With expense analytics you can digest expenses by space type, average expense, variable vs. fix as well as cost of vacancies, amongst others.This is coming v3, live September 29th.
Get Started with Occupier Analytics Dashboard
If you are an Occupier Lease Administration user, you have access to the Analytics Dashboard within your Lease Administration module and can start unlocking your real estate data instantly. Occupier Analytics Dashboard enables your team to visually digest your lease data. Get started with Occupier today and elevate your lease management processes.
